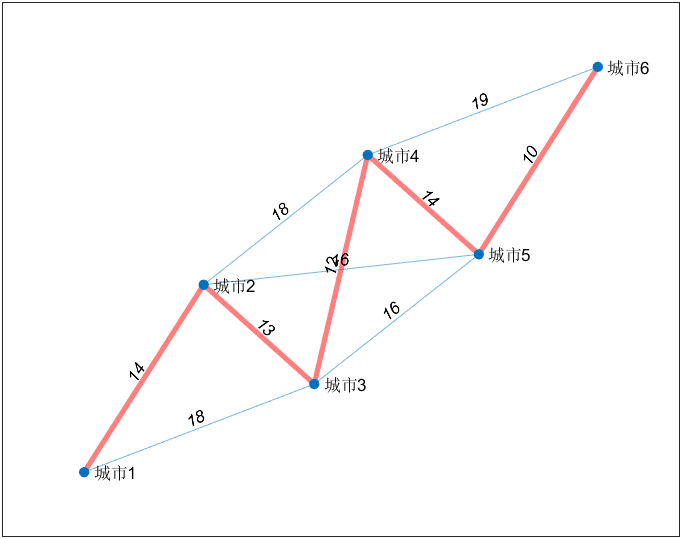
最小生成树
算法步骤
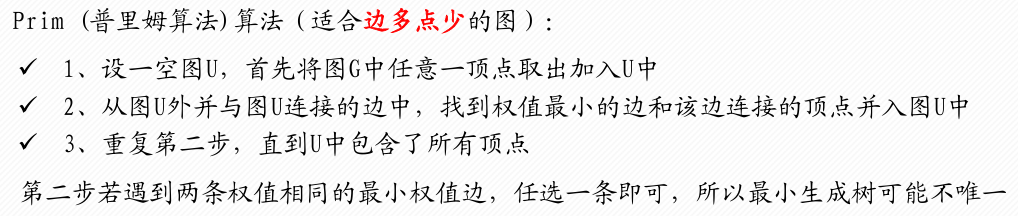
Prim
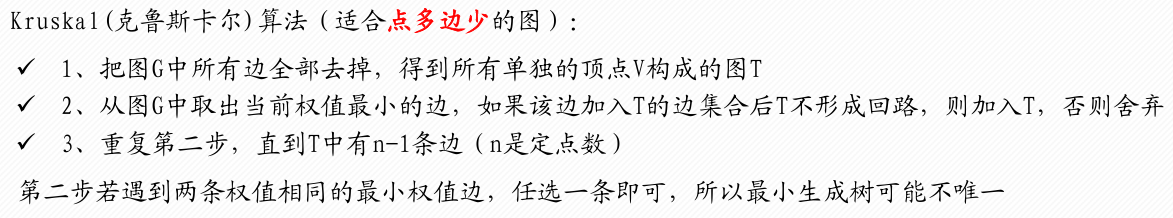
Kruskal
代码
1 | clc,clear |
代码输出结果
1 | L=63 |
本博客所有文章除特别声明外,均采用 CC BY-NC-SA 4.0 许可协议。转载请注明来源 Lee的学习之旅!
相关推荐
2025-01-02
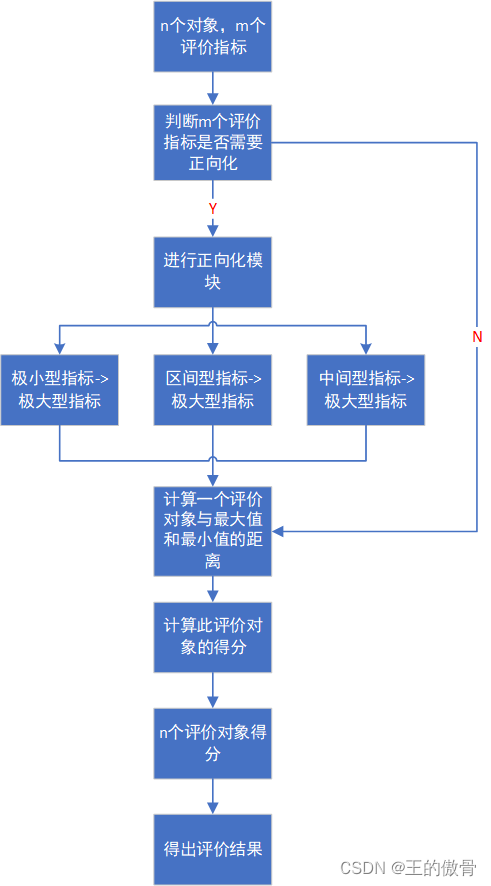
TOPSIS法
原理TOPSIS(Technique for Order Preference by Similarity to Ideal...
2025-01-14
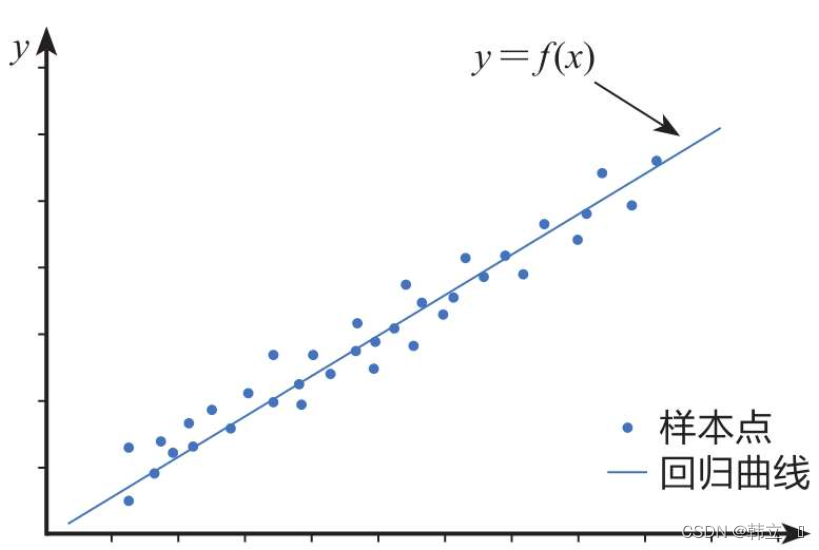
一元线性回归分析模型
原理一元线性回归分析模型(Simple Linear Regression Model)是一种统计方法,用于研究两个连续变量之间的关系:一个因变量(通常记为 (Y))和一个自变量(通常记为 (X))。这个模型假设这两个变量之间存在线性关系,并试图通过最小化预测值与实际观测值之间的差异来拟合一条直线。 残差图作图命令:rcoplot(r,rint) 建模步骤 数据收集:首先需要收集包含因变量和自变量的数据集。 模型设定:设定一元线性回归模型的形式,即 (Y = \beta_0 + \beta_1 X + \epsilon)。 参数估计:使用最小二乘法(Ordinary Least Squares, OLS)等方法来估计未知参数 (\beta_0) 和 (\beta_1)。OLS的目标是找到使残差平方和最小化的参数值,即 (\sum (Y_i - (\beta_0 + \beta_1 X_i))^2)...
2025-01-14
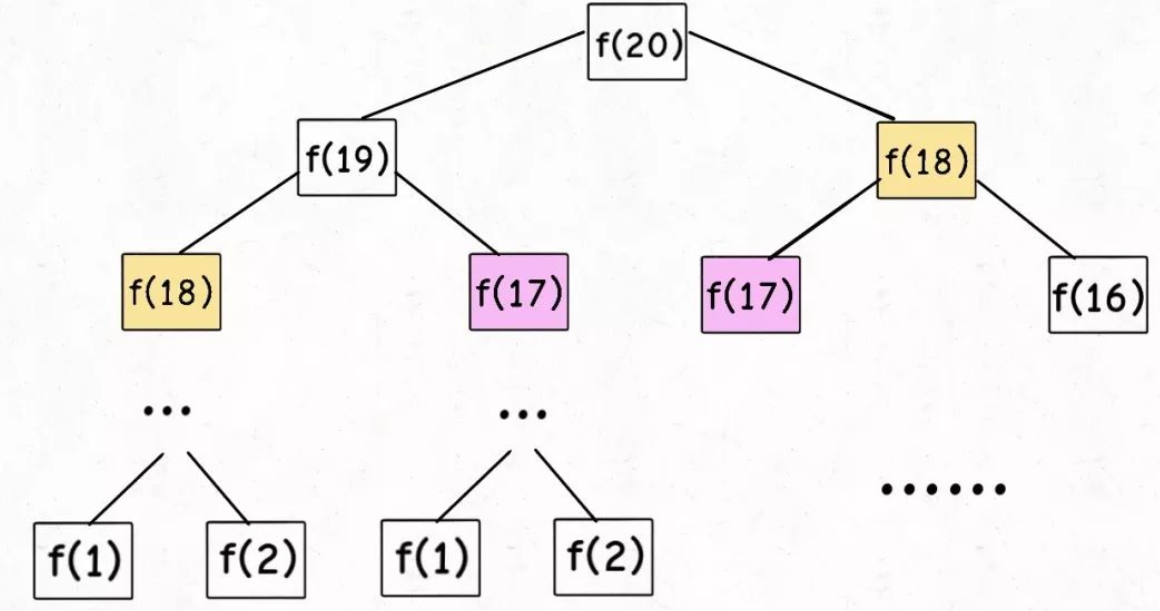
动态规划模型
原理动态规划(Dynamic...

2025-03-18
函数极值与规划模型
矩阵运算12345678910111213141516171819202122232425import numpy as npa=np.array([[1,2,3],[4,5,6]])b=np.array([[1,2],[3,4],[5,6]])c=np.array([[1,2,3]])d=np.array([[9,8,7],[3,2,1]])#矩阵加法sum=a+d#放缩e=3*a#数乘、矩阵乘e=np.dot(a,b)#元素乘e=a*dprint(e)#转置e=c.Tprint(e)e=np.array([[1,2],[3,4]])#逆矩阵result=np.linalg.inv(e)#行列式result=np.linalg.det(e)#矩阵的秩e=np.linalg.matrix_rank(d)print(e) 求一次方程组的解 1234567891011121314151617import numpy as np#用于第一段代码from sympy import...
2025-01-14
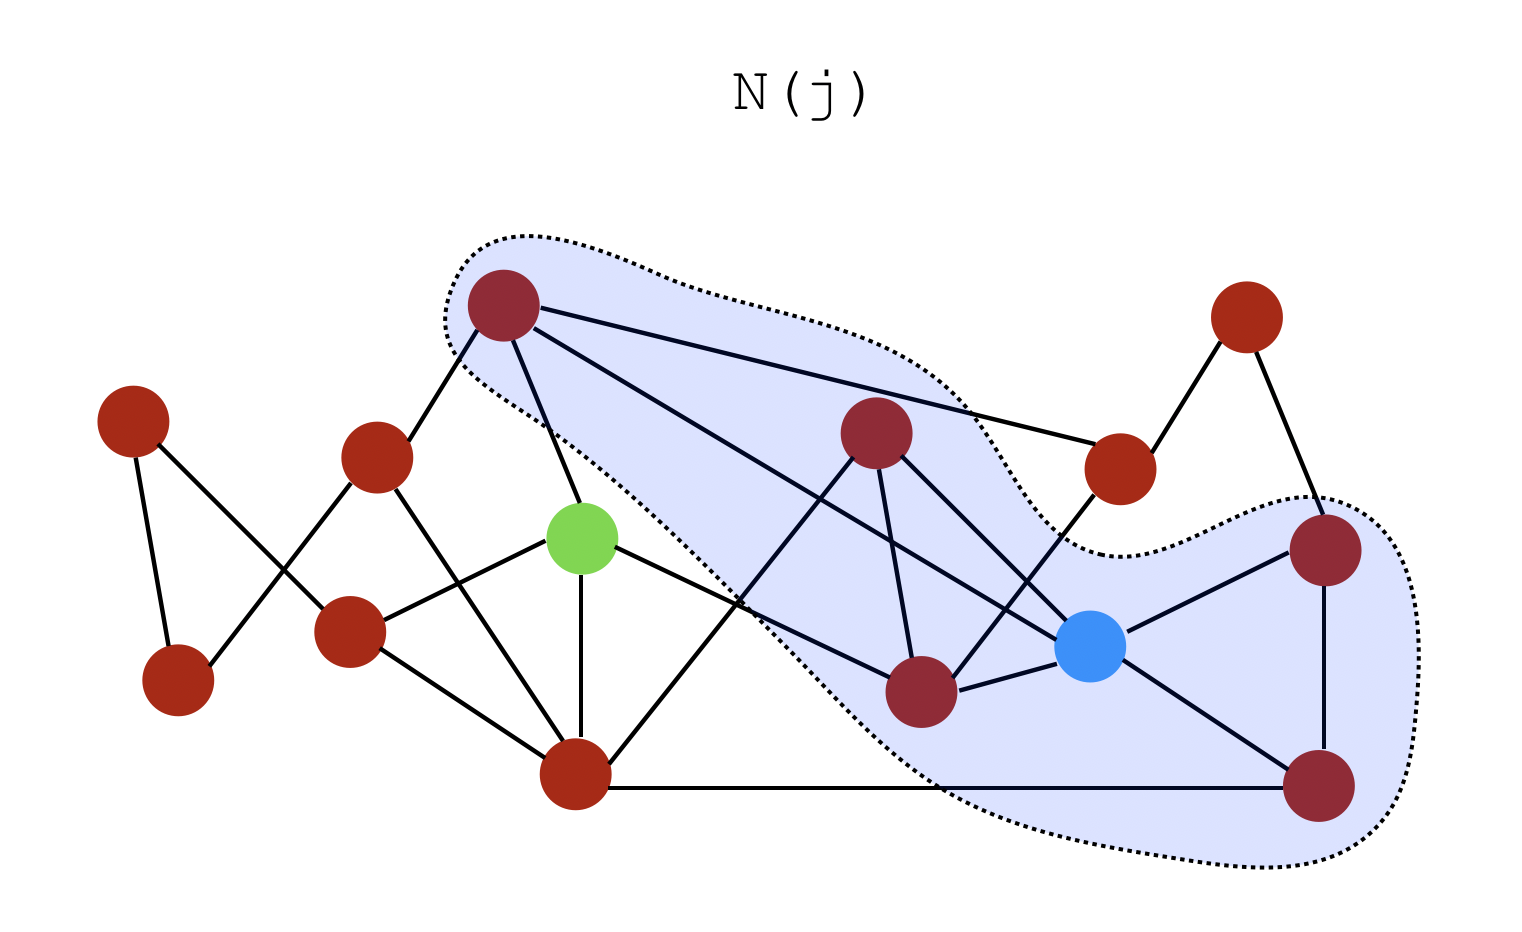
图论模型
Matlab作无向图(1)无权重(每条边的权重默认为1)函数**graph(s,t)**:可在 s 和 t 中的对应节点之间创建边,并生成一个图 s 和 t 都必须具有相同的元素数;这些节点必须都是从1开始的正整数,或都是字符串元胞数组。 注意哦,编号最好是从1开始连续编号,不要自己随便定义编号 123456789101112131415s1 = [1,2,3,4];t1 = [2,3,1,1];G1 = graph(s1, t1);plot(G1)% 下面的命令是在画图后不显示坐标set( gca, 'XTick', [], 'YTick', [] ); % 注意字符串元胞数组是用大括号包起来的哦s2 = {'学校','电影院','网吧','酒店'};t2 = {'电影院','酒店','酒店','KTV'};G2 = graph(s2,...
2025-01-12
主成分分析法
原理主成分分析法(Principal Component...